
Shipped
Shipped
Shipped
SaaS
SaaS
SaaS
Saving Time with Smarter Project Oversight
Saving Time with Smarter Project Oversight
Saving Time with Smarter Project Oversight
Spartan Solar · 2024
ROLE
Design Lead
SKILLS
Product Design
Stakeholder Management
Prototyping
TIMELINE
Nov ‘24 - Dec ‘24
TEAM
2 Designers, 1 Engineer
Introduction
Introduction
Introduction
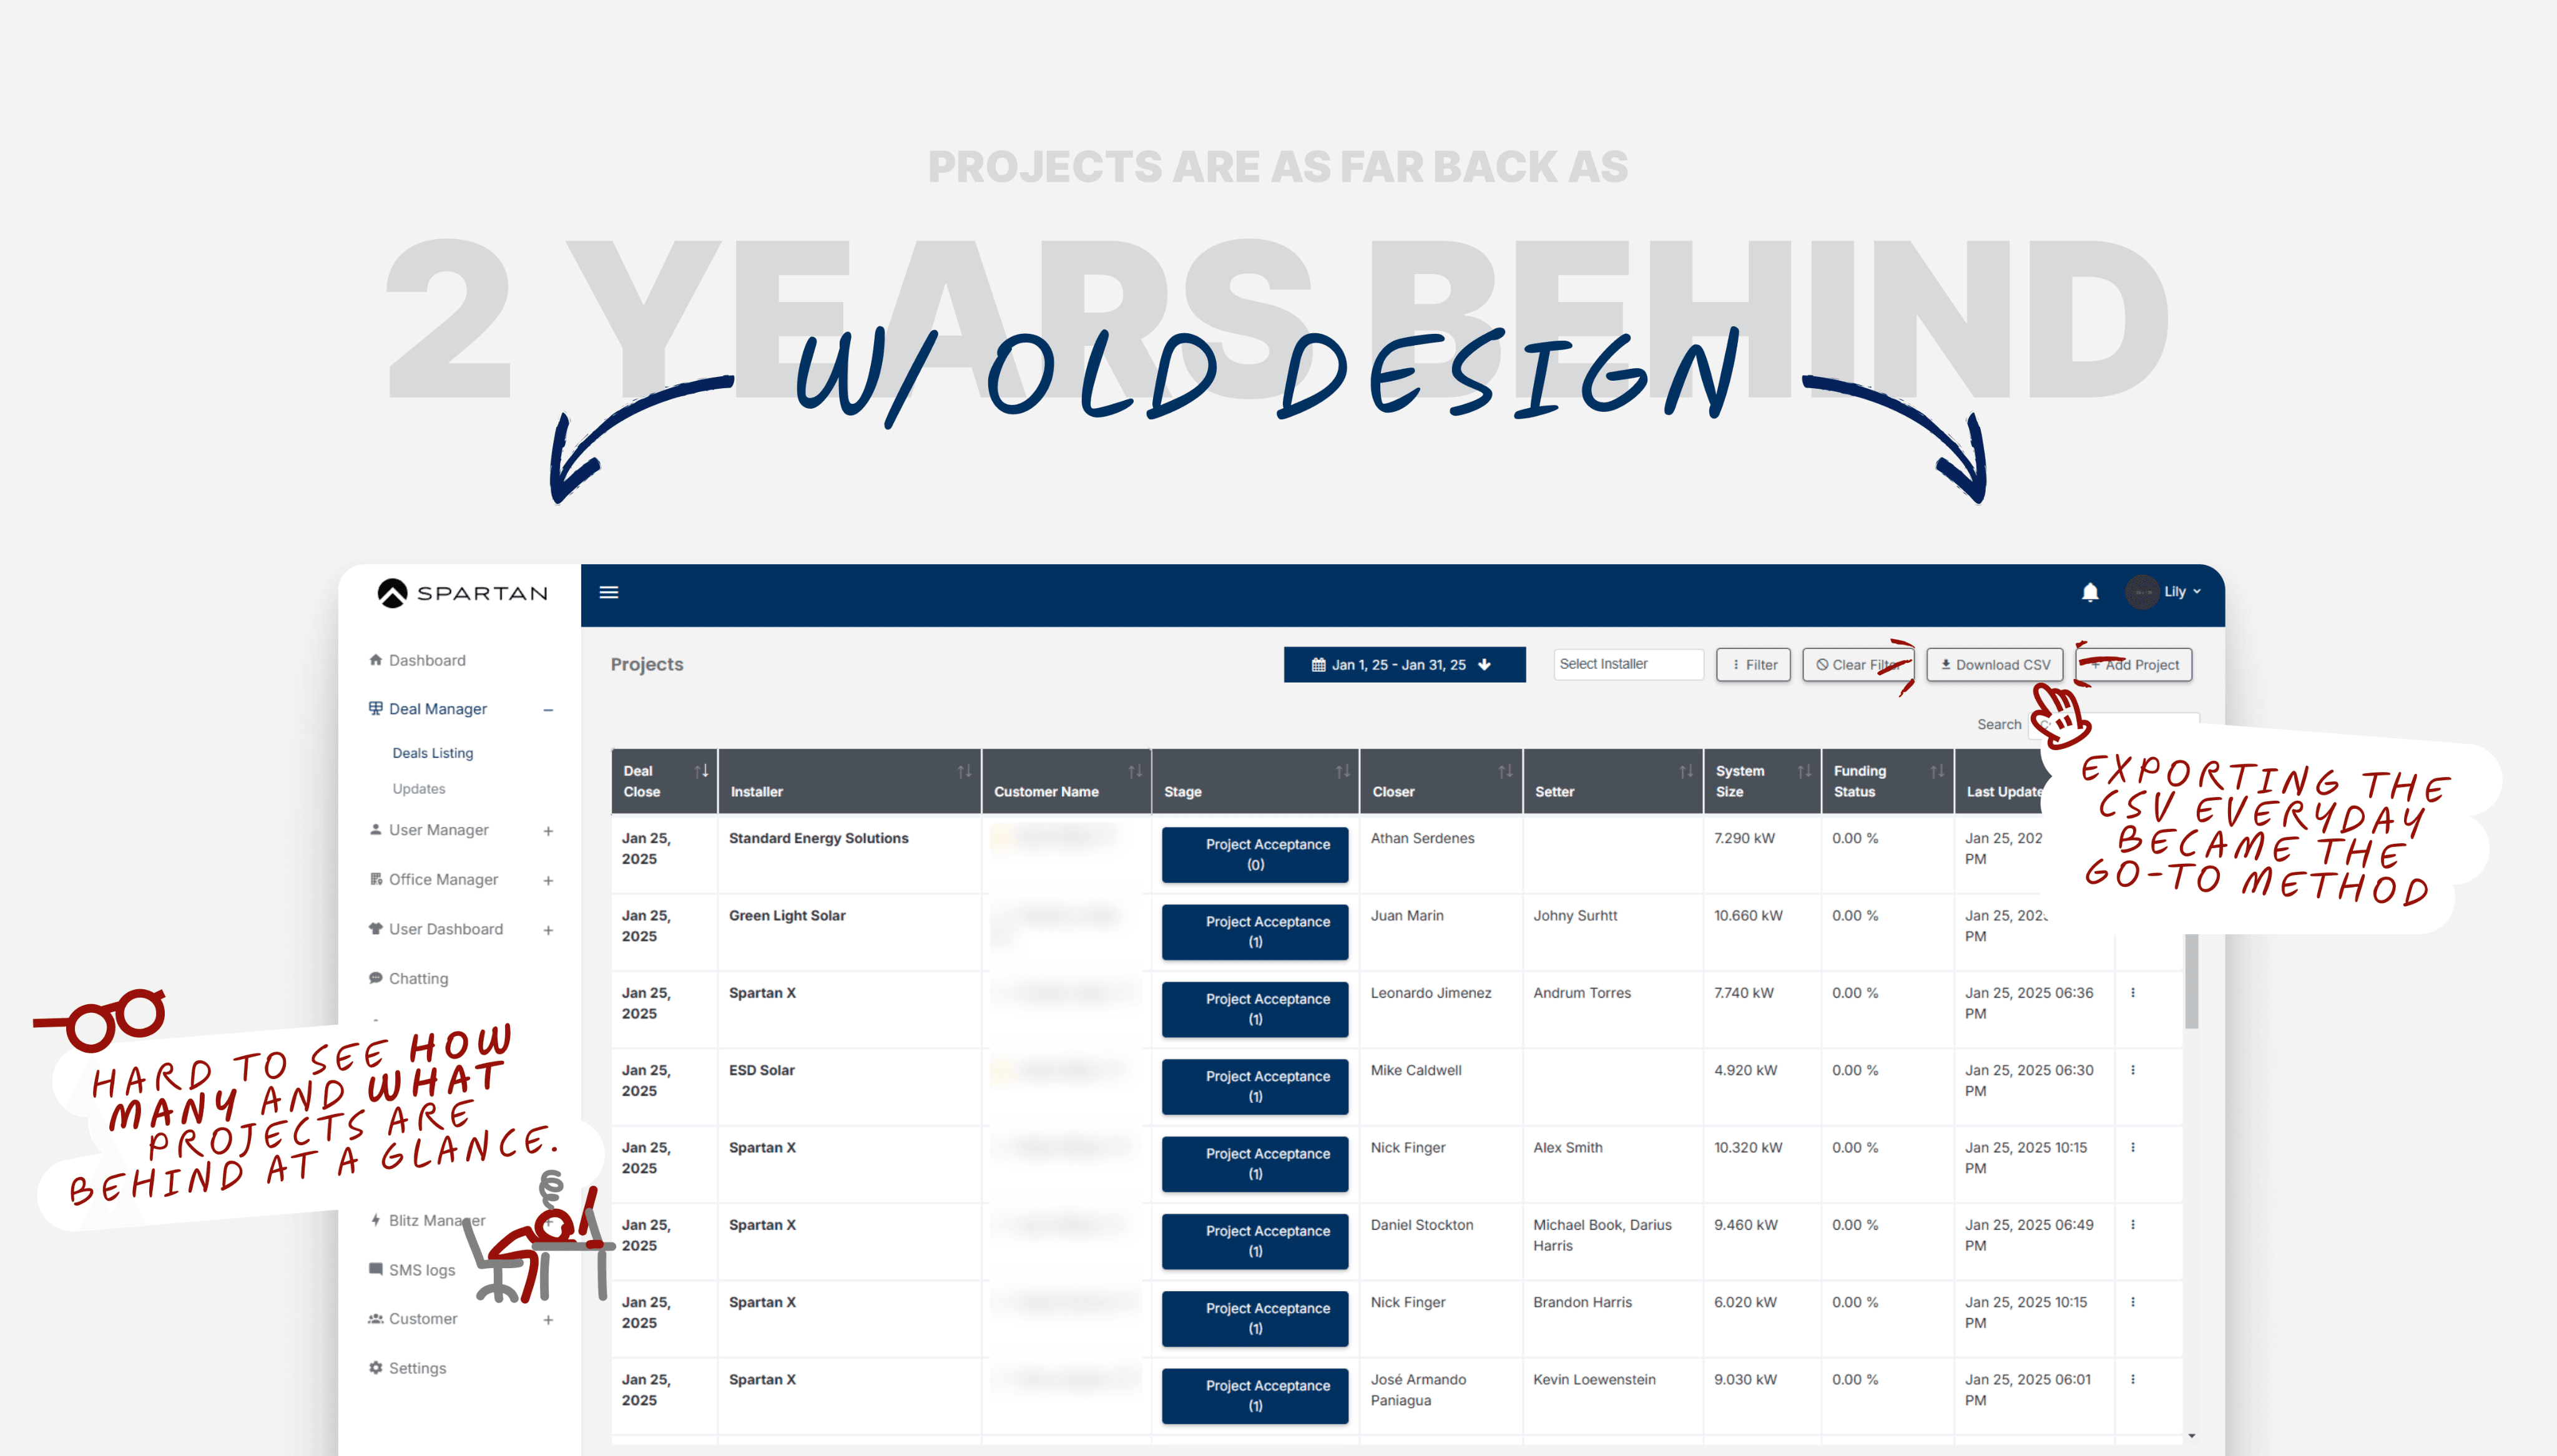
The project list was a key tool for managers to track solar sales progress. But as the company scaled, delays piled up—some projects were two years behind schedule with no way to identify risks early. Leadership wanted a Kanban dashboard, but that wouldn’t solve the real pain points.
The project list was a key tool for managers to track solar sales progress. But as the company scaled, delays piled up—some projects were two years behind schedule with no way to identify risks early. Leadership wanted a Kanban dashboard, but that wouldn’t solve the real pain points.
The project list was a key tool for managers to track solar sales progress. But as the company scaled, delays piled up—some projects were two years behind schedule with no way to identify risks early. Leadership wanted a Kanban dashboard, but that wouldn’t solve the real pain points.
My Role
My Role
My Role
I ensured the proposed design aligned with project managers’ needs, which led me to overhaul the platform to surface real-time insights, flag delays, and support faster intervention. This significantly reduced manual reporting time and helped leadership make data-driven decisions twice as quickly.
I ensured the proposed design aligned with project managers’ needs, which led me to overhaul the platform to surface real-time insights, flag delays, and support faster intervention. This significantly reduced manual reporting time and helped leadership make data-driven decisions twice as quickly.
I ensured the proposed design aligned with project managers’ needs, which led me to overhaul the platform to surface real-time insights, flag delays, and support faster intervention. This significantly reduced manual reporting time and helped leadership make data-driven decisions twice as quickly.
This case study shows the simplest version of the final design. All stats and data are fictional for NDA purposes.
This case study shows the simplest version of the final design. All stats and data are fictional for NDA purposes.
This case study shows the simplest version of the final design. All stats and data are fictional for NDA purposes.

CEO
CEO
CEO
“We don’t know how many projects are outside SLA at each stage. By the time we know where a job is, it’s too late.”
“We don’t know how many projects are outside SLA at each stage. By the time we know where a job is, it’s too late.”
“We don’t know how many projects are outside SLA at each stage. By the time we know where a job is, it’s too late.”
The Challenge
The Challenge
The Challenge
4 interviews with project managers and upper management revealed that:
4 interviews with project managers and upper management revealed that:
4 interviews with project managers and upper management revealed that:
Managers lacked visibility into delayed projects.
Managers lacked visibility into delayed projects.
Managers lacked visibility into delayed projects.
PMs spent hours manually exporting and filtering data.
PMs spent hours manually exporting and filtering data.
PMs spent hours manually exporting and filtering data.
Leadership had no easy way to track company health.
Leadership had no easy way to track company health.
Leadership had no easy way to track company health.
How might we optimize the PM workflow to get back on track and minimize project losses?
How might we optimize the PM workflow to get back on track and minimize project losses?
How might we optimize the PM workflow to get back on track and minimize project losses?
Stakeholder’s Proposed Solution
Stakeholder’s Proposed Solution
Stakeholder’s Proposed Solution
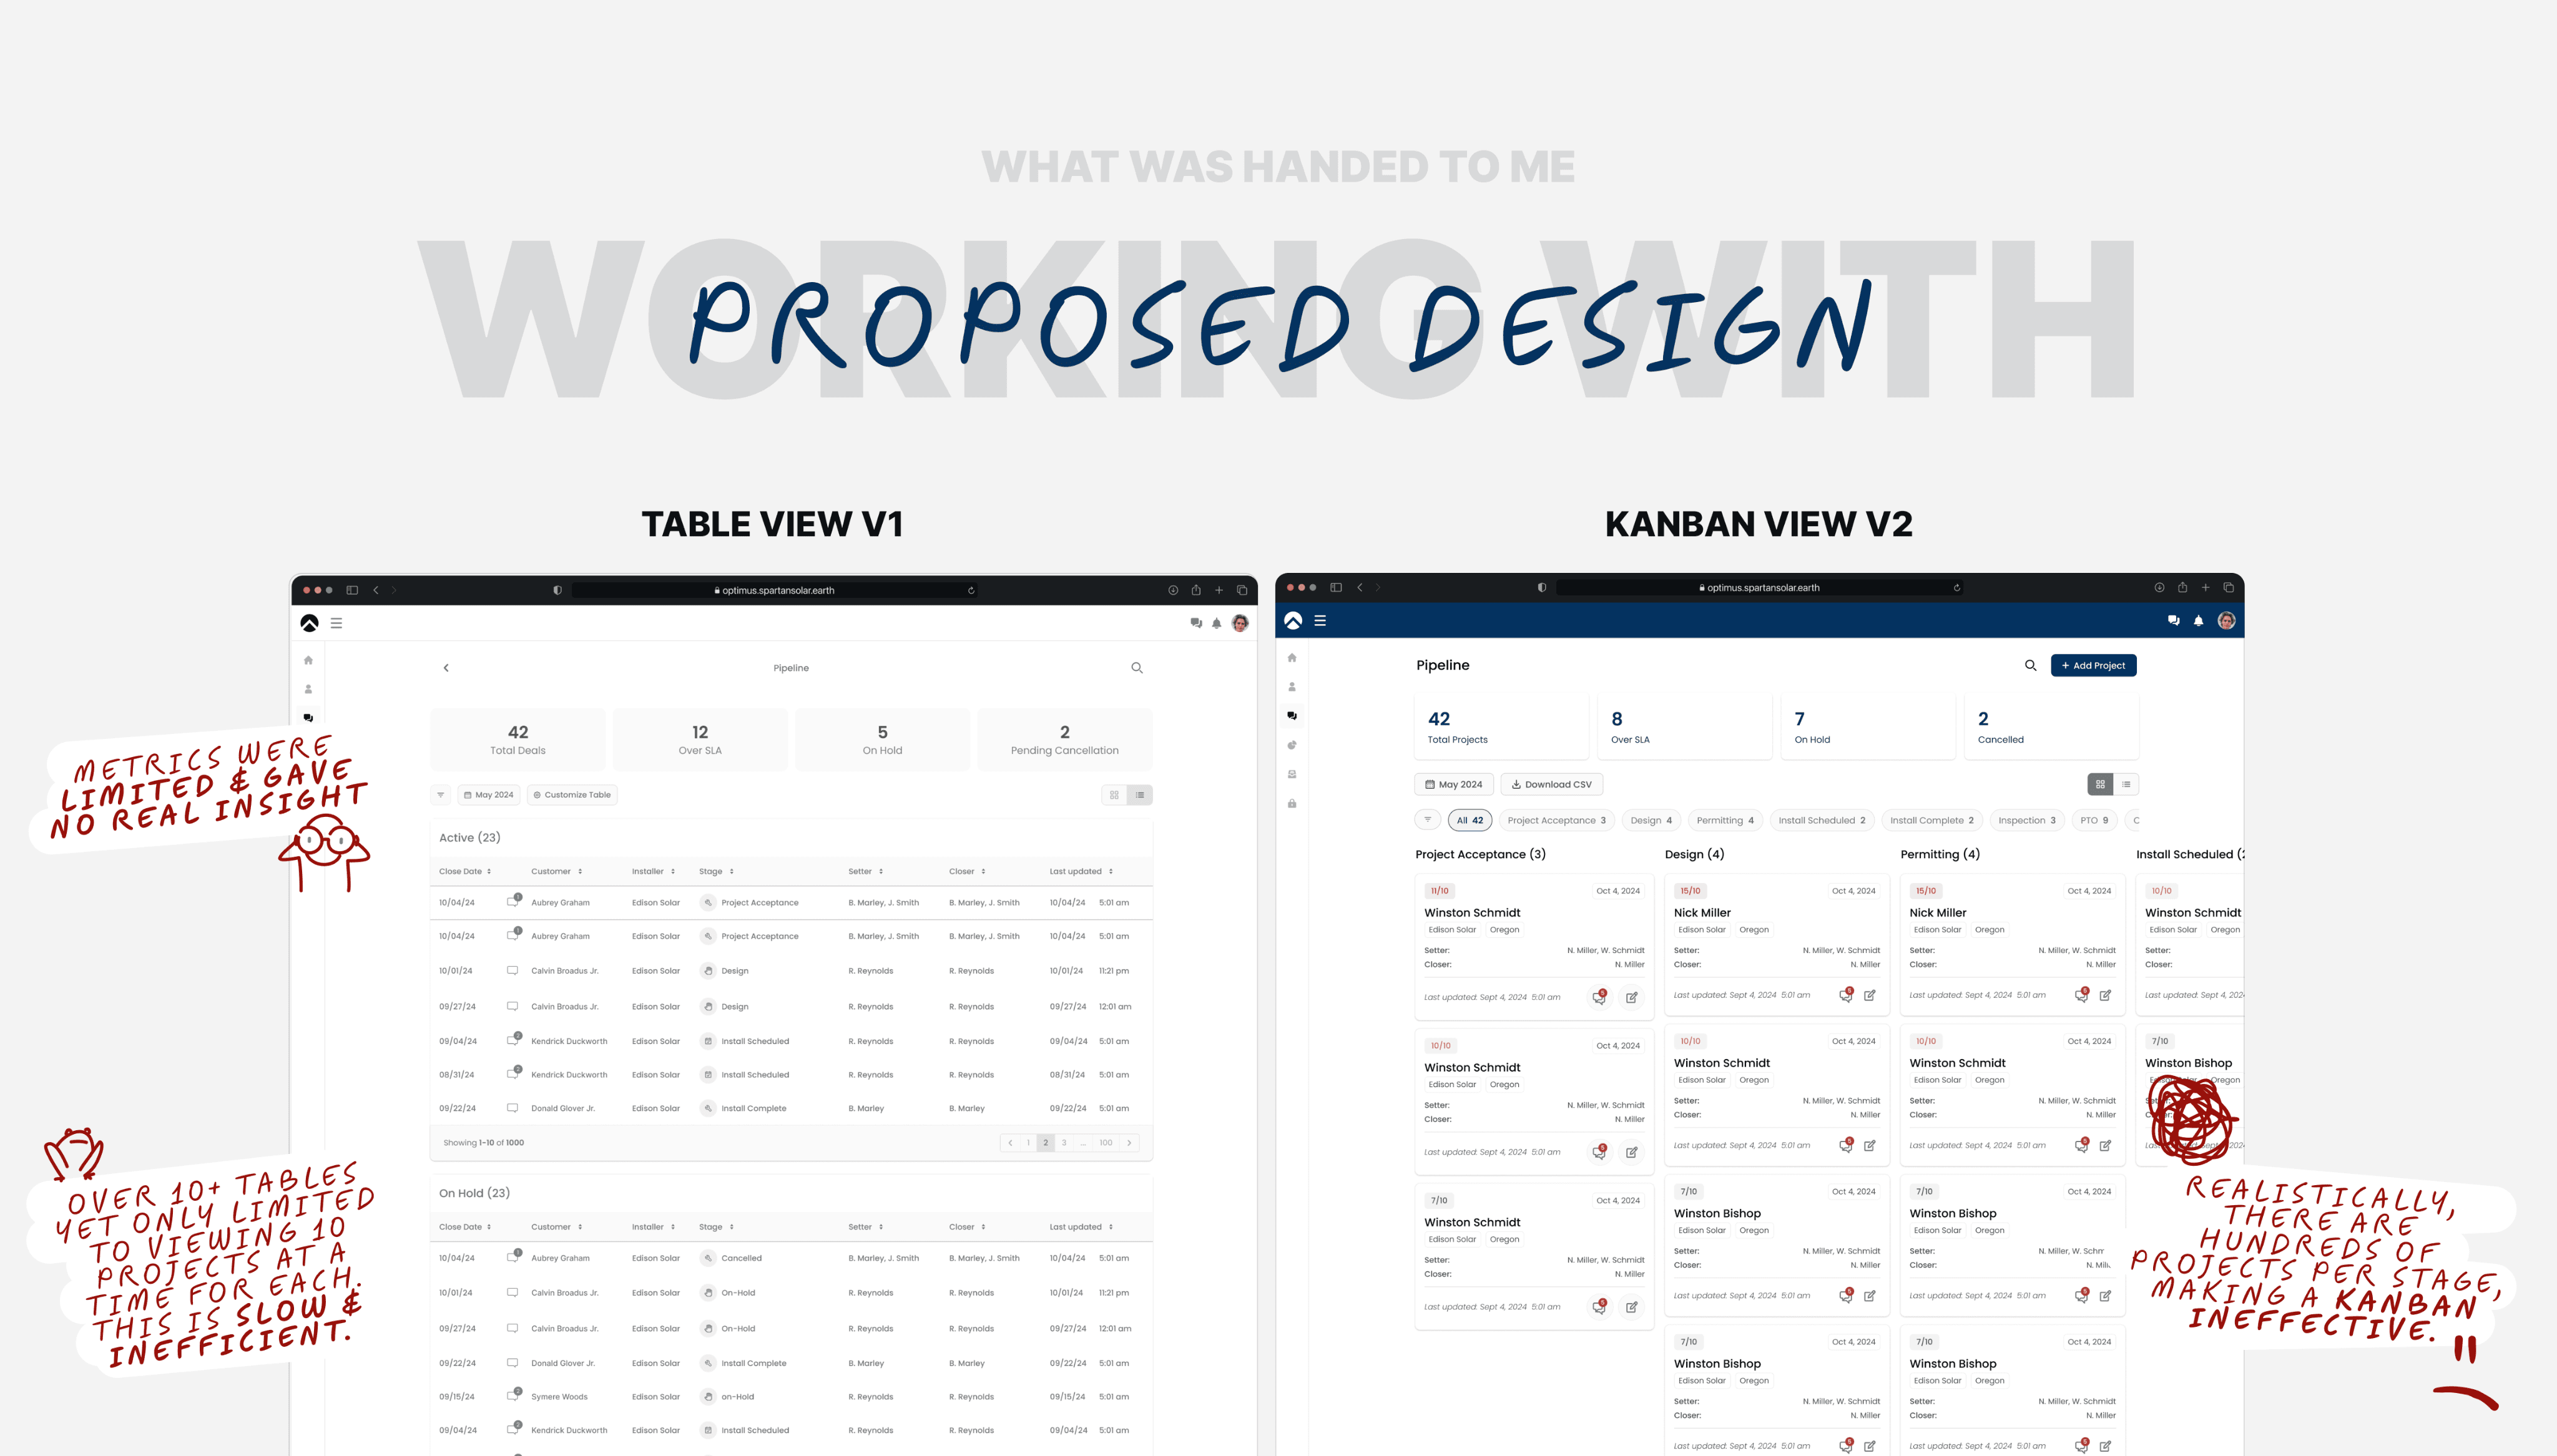
Leadership wanted a dashboard with a Kanban board and project phase tables. However, it didn’t address PMs' daily workflow challenges or reduce inefficiencies.
Leadership wanted a dashboard with a Kanban board and project phase tables. However, it didn’t address PMs' daily workflow challenges or reduce inefficiencies.
Leadership wanted a dashboard with a Kanban board and project phase tables. However, it didn’t address PMs' daily workflow challenges or reduce inefficiencies.
Designing for Adoption & Execution
Designing for Adoption & Execution
Designing for Adoption & Execution
In order to push for my alternative solution, I worked closely with all teams involved:
In order to push for my alternative solution, I worked closely with all teams involved:
In order to push for my alternative solution, I worked closely with all teams involved:
• I worked with engineers to ensure technical feasibility.
• I prioritized manager usability while addressing leadership goals.
• I kept designs flexible for different PM workflows.
• I worked with engineers to ensure technical feasibility.
• I prioritized manager usability while addressing leadership goals.
• I kept designs flexible for different PM workflows.
• I worked with engineers to ensure technical feasibility.
• I prioritized manager usability while addressing leadership goals.
• I kept designs flexible for different PM workflows.
IMPACT
IMPACT
IMPACT
EFFORT
EFFORT
EFFORT
Low
Low
Low
High
High
High
High
High
High
SMS Messaging w/ HO
Project Tagging
All Projects Table View
All Projects Kanban View
Project Funnel Graph
Due to time and technical constraints, I helped brainstorm alternative solutions and prioritize the most important features.
Due to time and technical constraints, I helped brainstorm alternative solutions and prioritize the most important features.
Due to time and technical constraints, I helped brainstorm alternative solutions and prioritize the most important features.
Solution
Solution
Solution
The redesign solves for key pain points by providing:
The redesign solves for key pain points by providing:
The redesign solves for key pain points by providing:
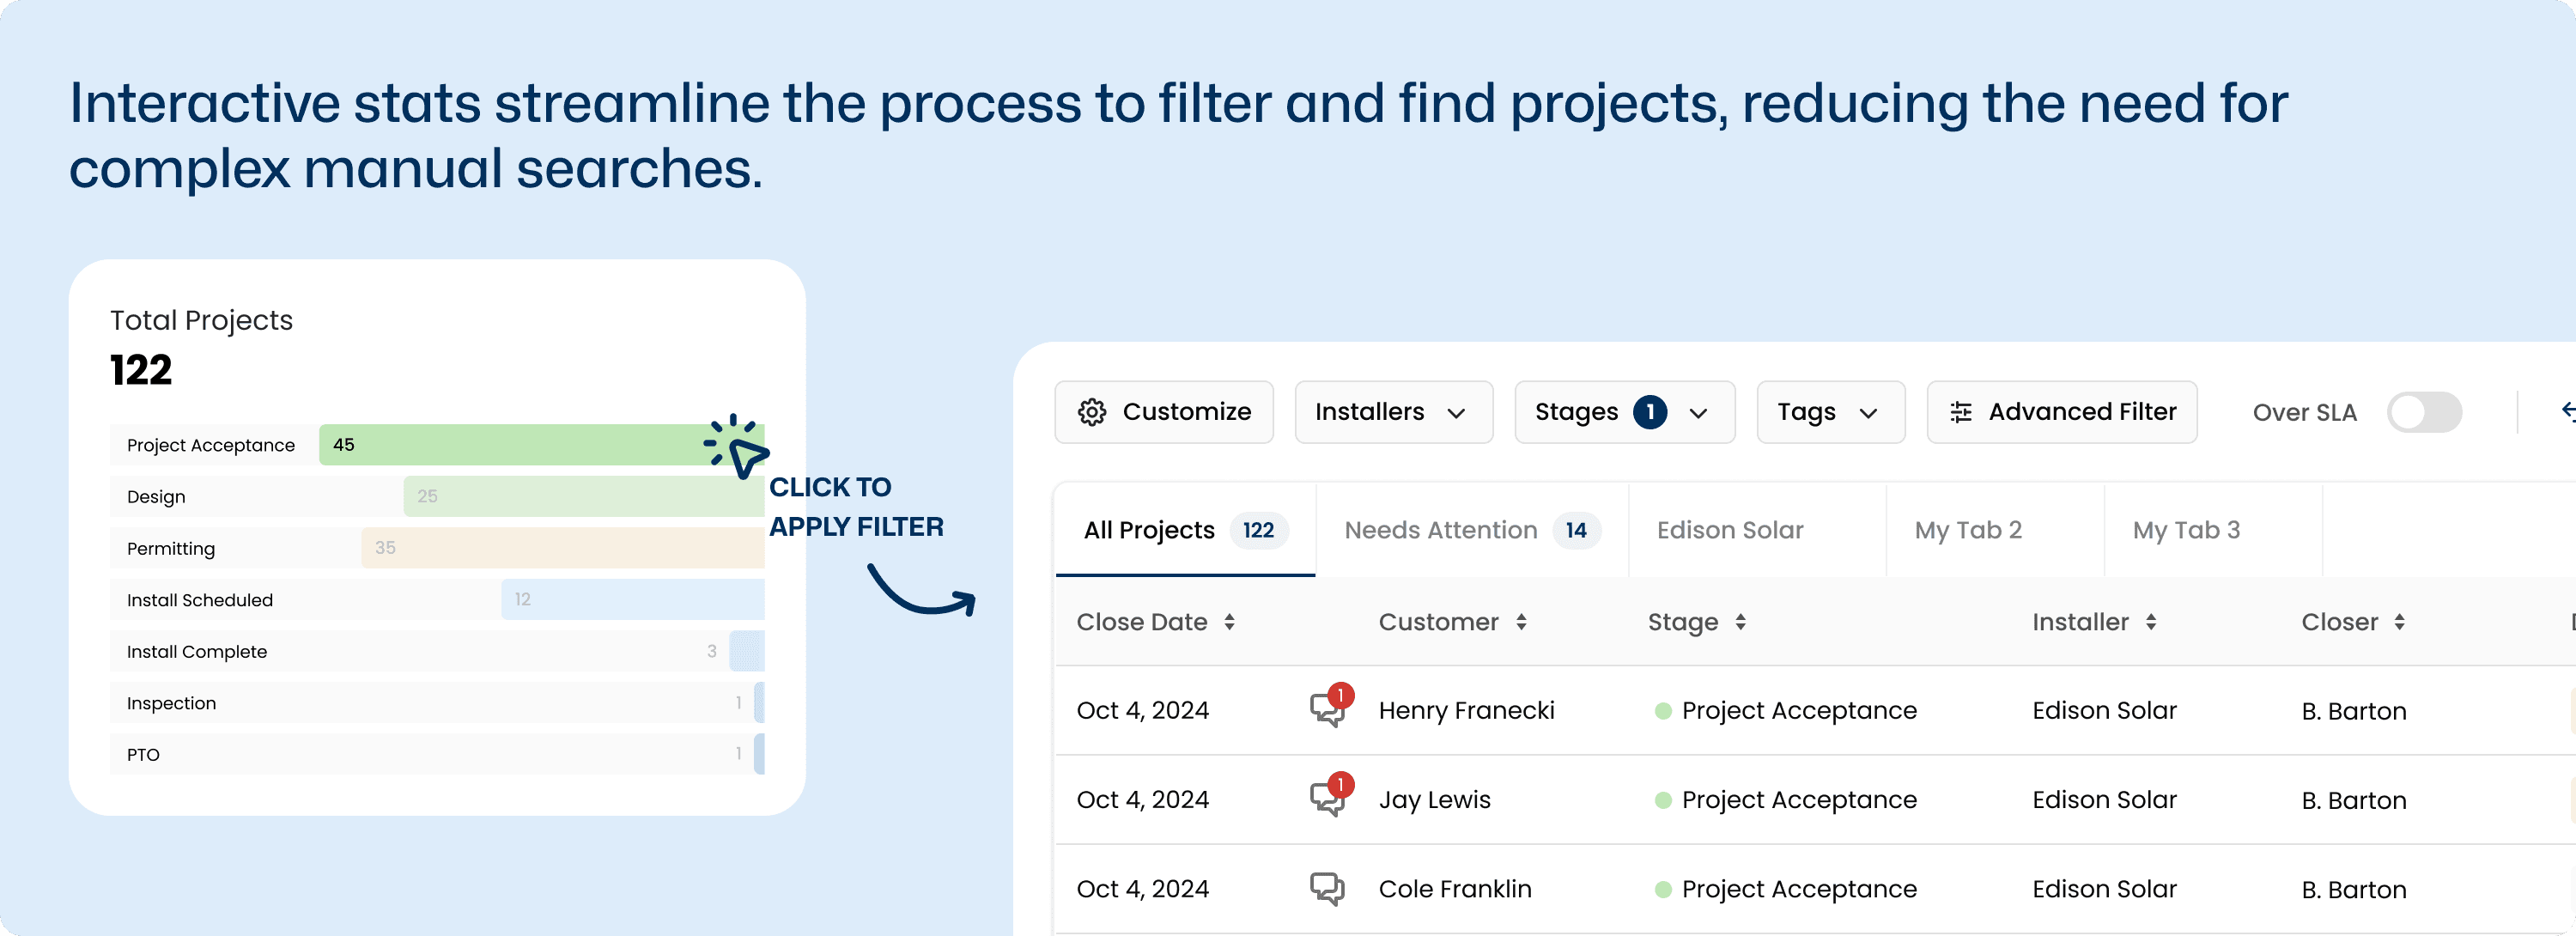
Flexible metrics that adapt to user filters and instantly highlight KPIs
Flexible metrics that adapt to user filters and instantly highlight KPIs
Flexible metrics that adapt to user filters and instantly highlight KPIs

Interactive Graphs & Color-Coded Tags to quickly highlight bottlenecks and delays
Interactive Graphs & Color-Coded Tags to quickly highlight bottlenecks and delays
Interactive Graphs & Color-Coded Tags to quickly highlight bottlenecks and delays

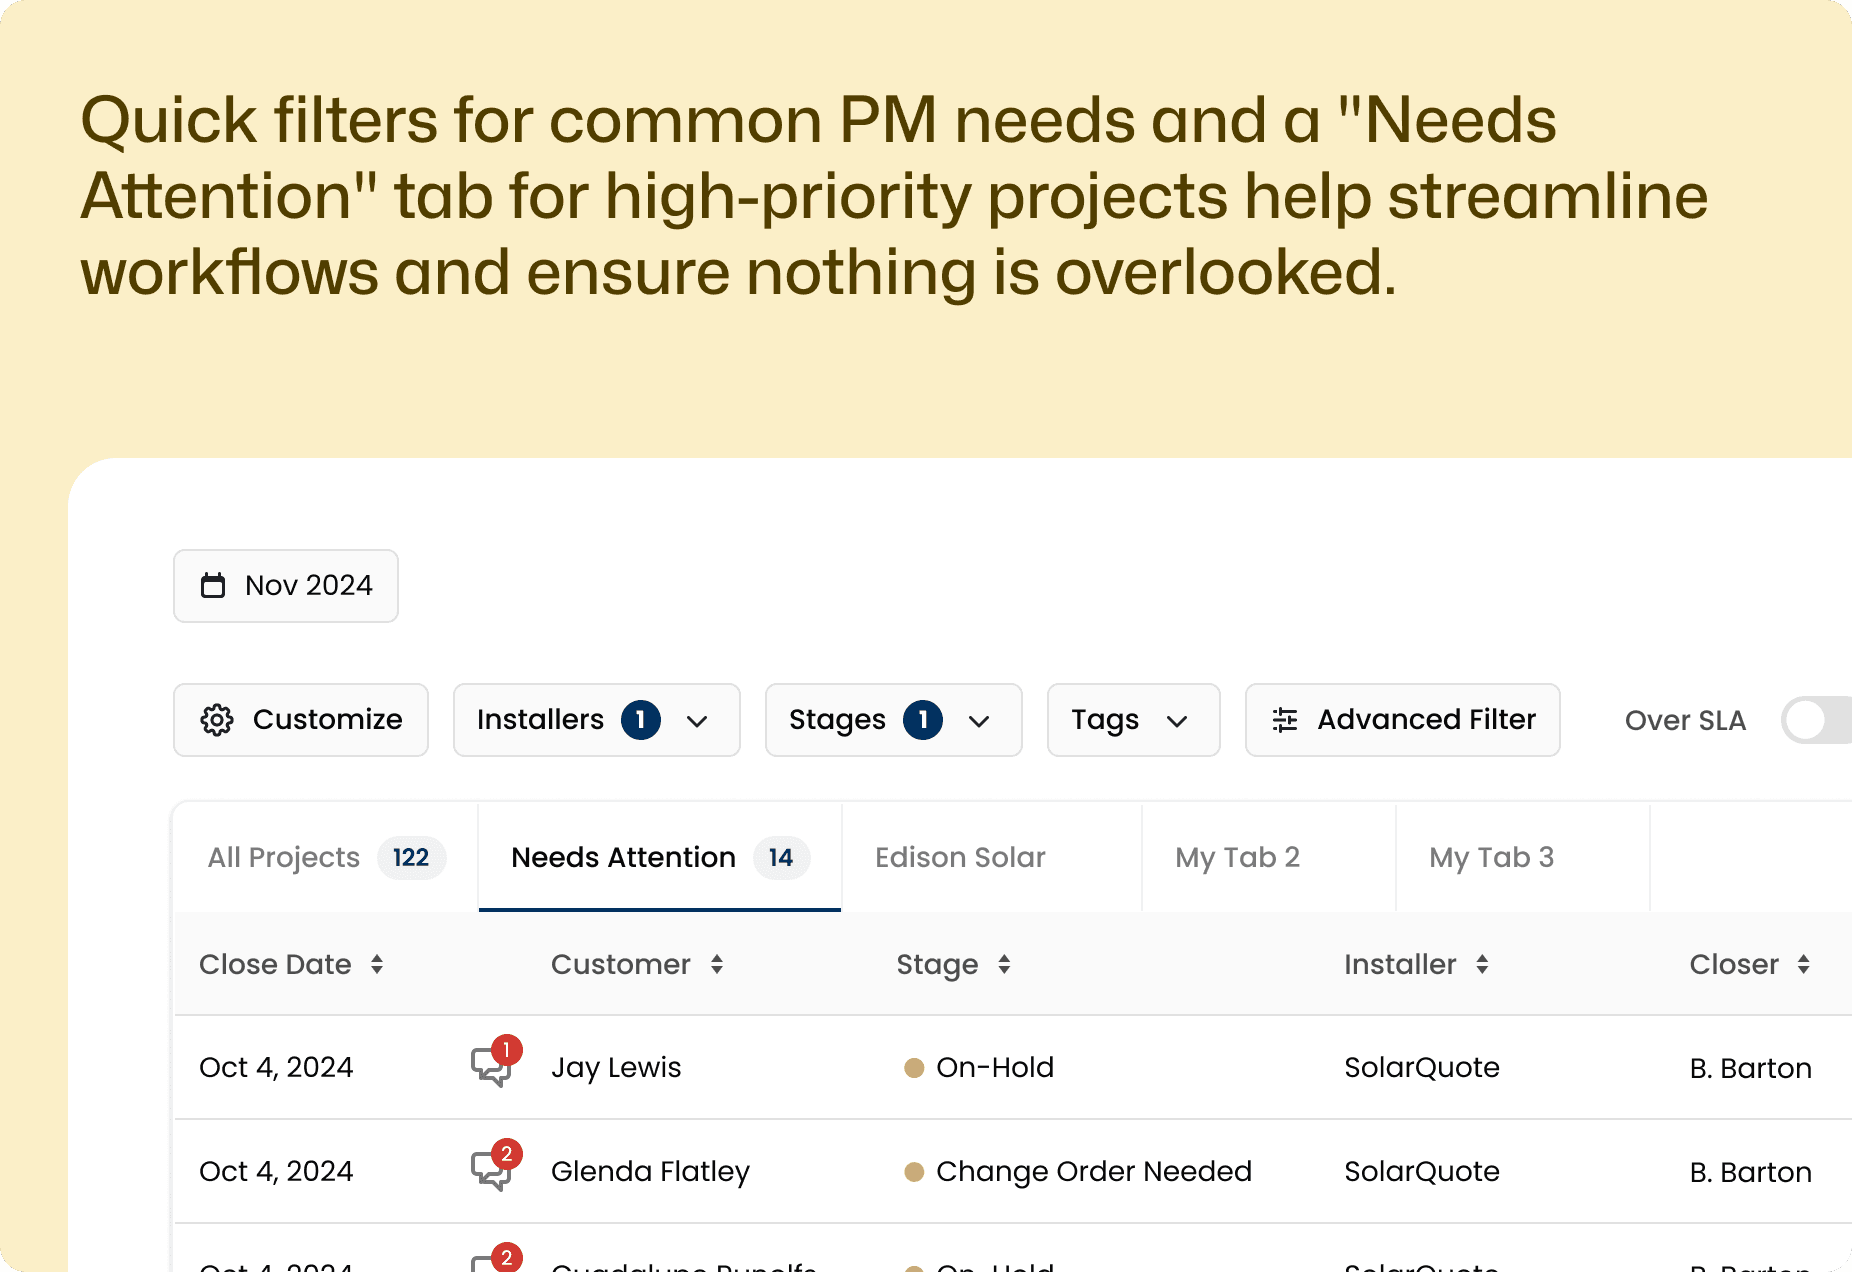
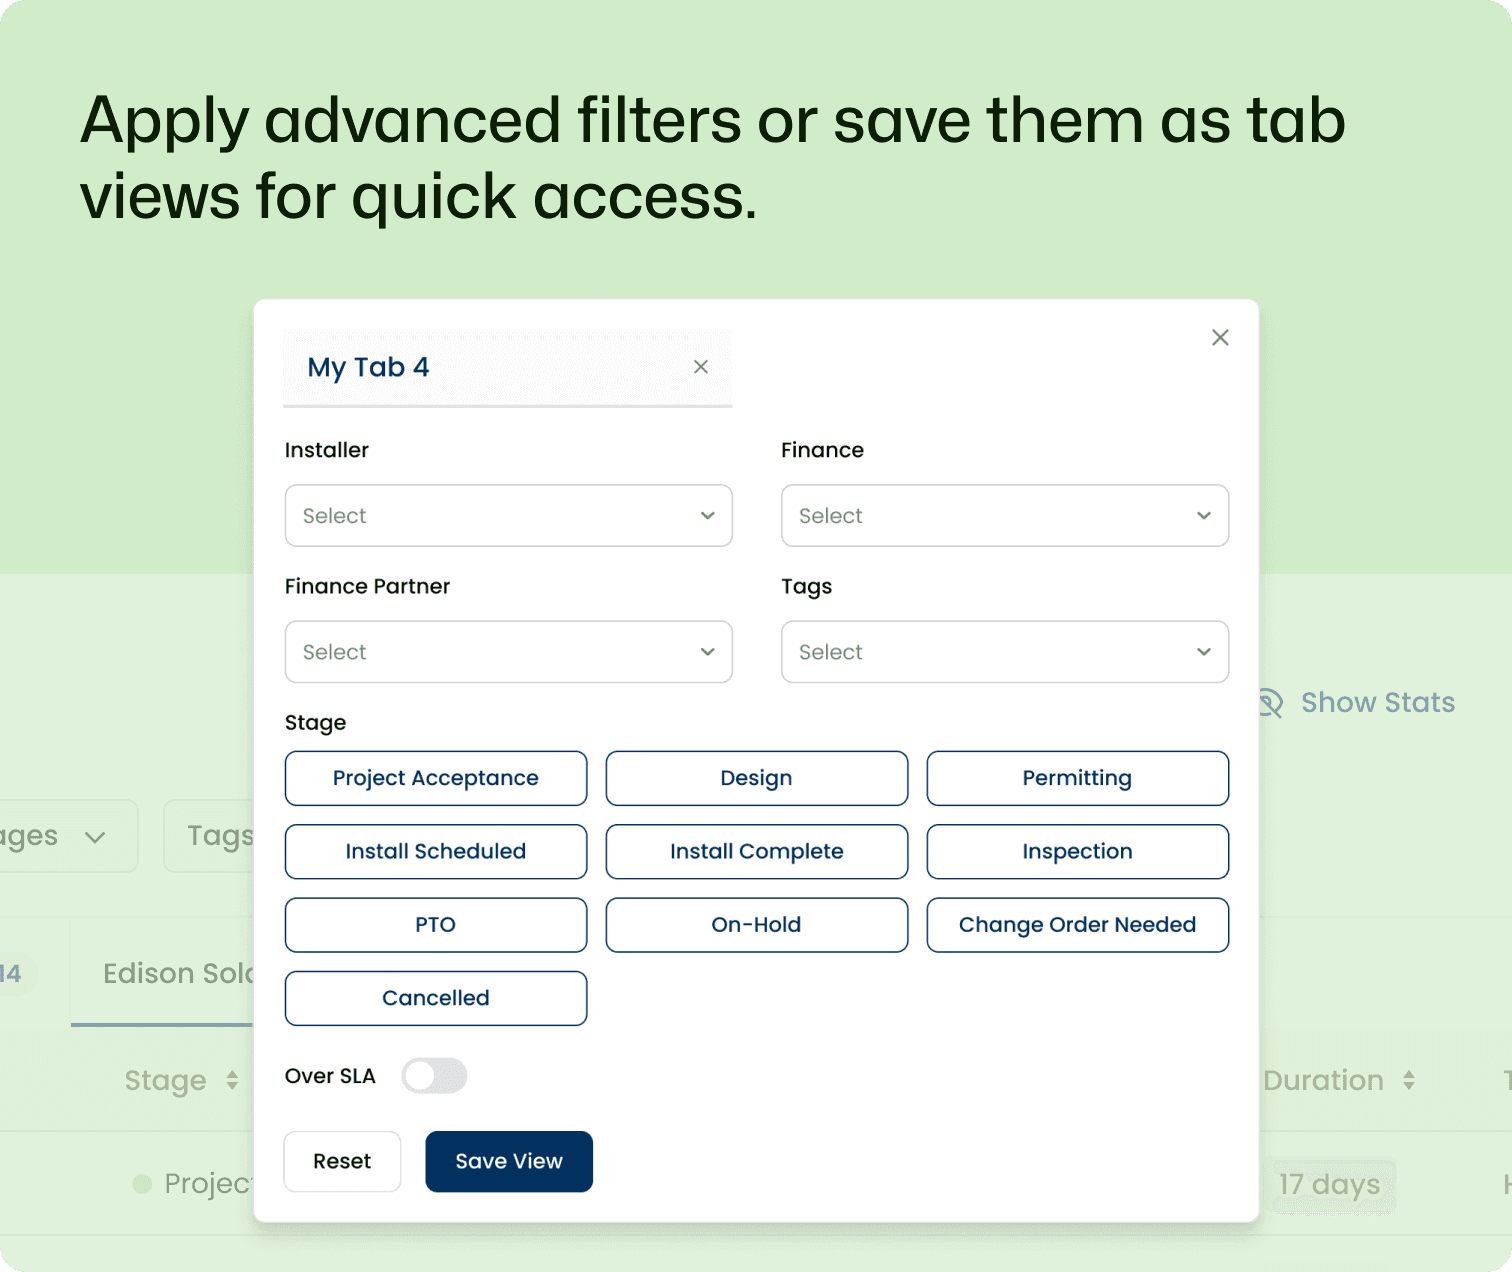
Advanced Filters & Saved Views to eliminate the need for PMs to manually export and filter project lists repeatedly
Advanced Filters & Saved Views to eliminate the need for PMs to manually export and filter project lists repeatedly
Advanced Filters & Saved Views to eliminate the need for PMs to manually export and filter project lists repeatedly
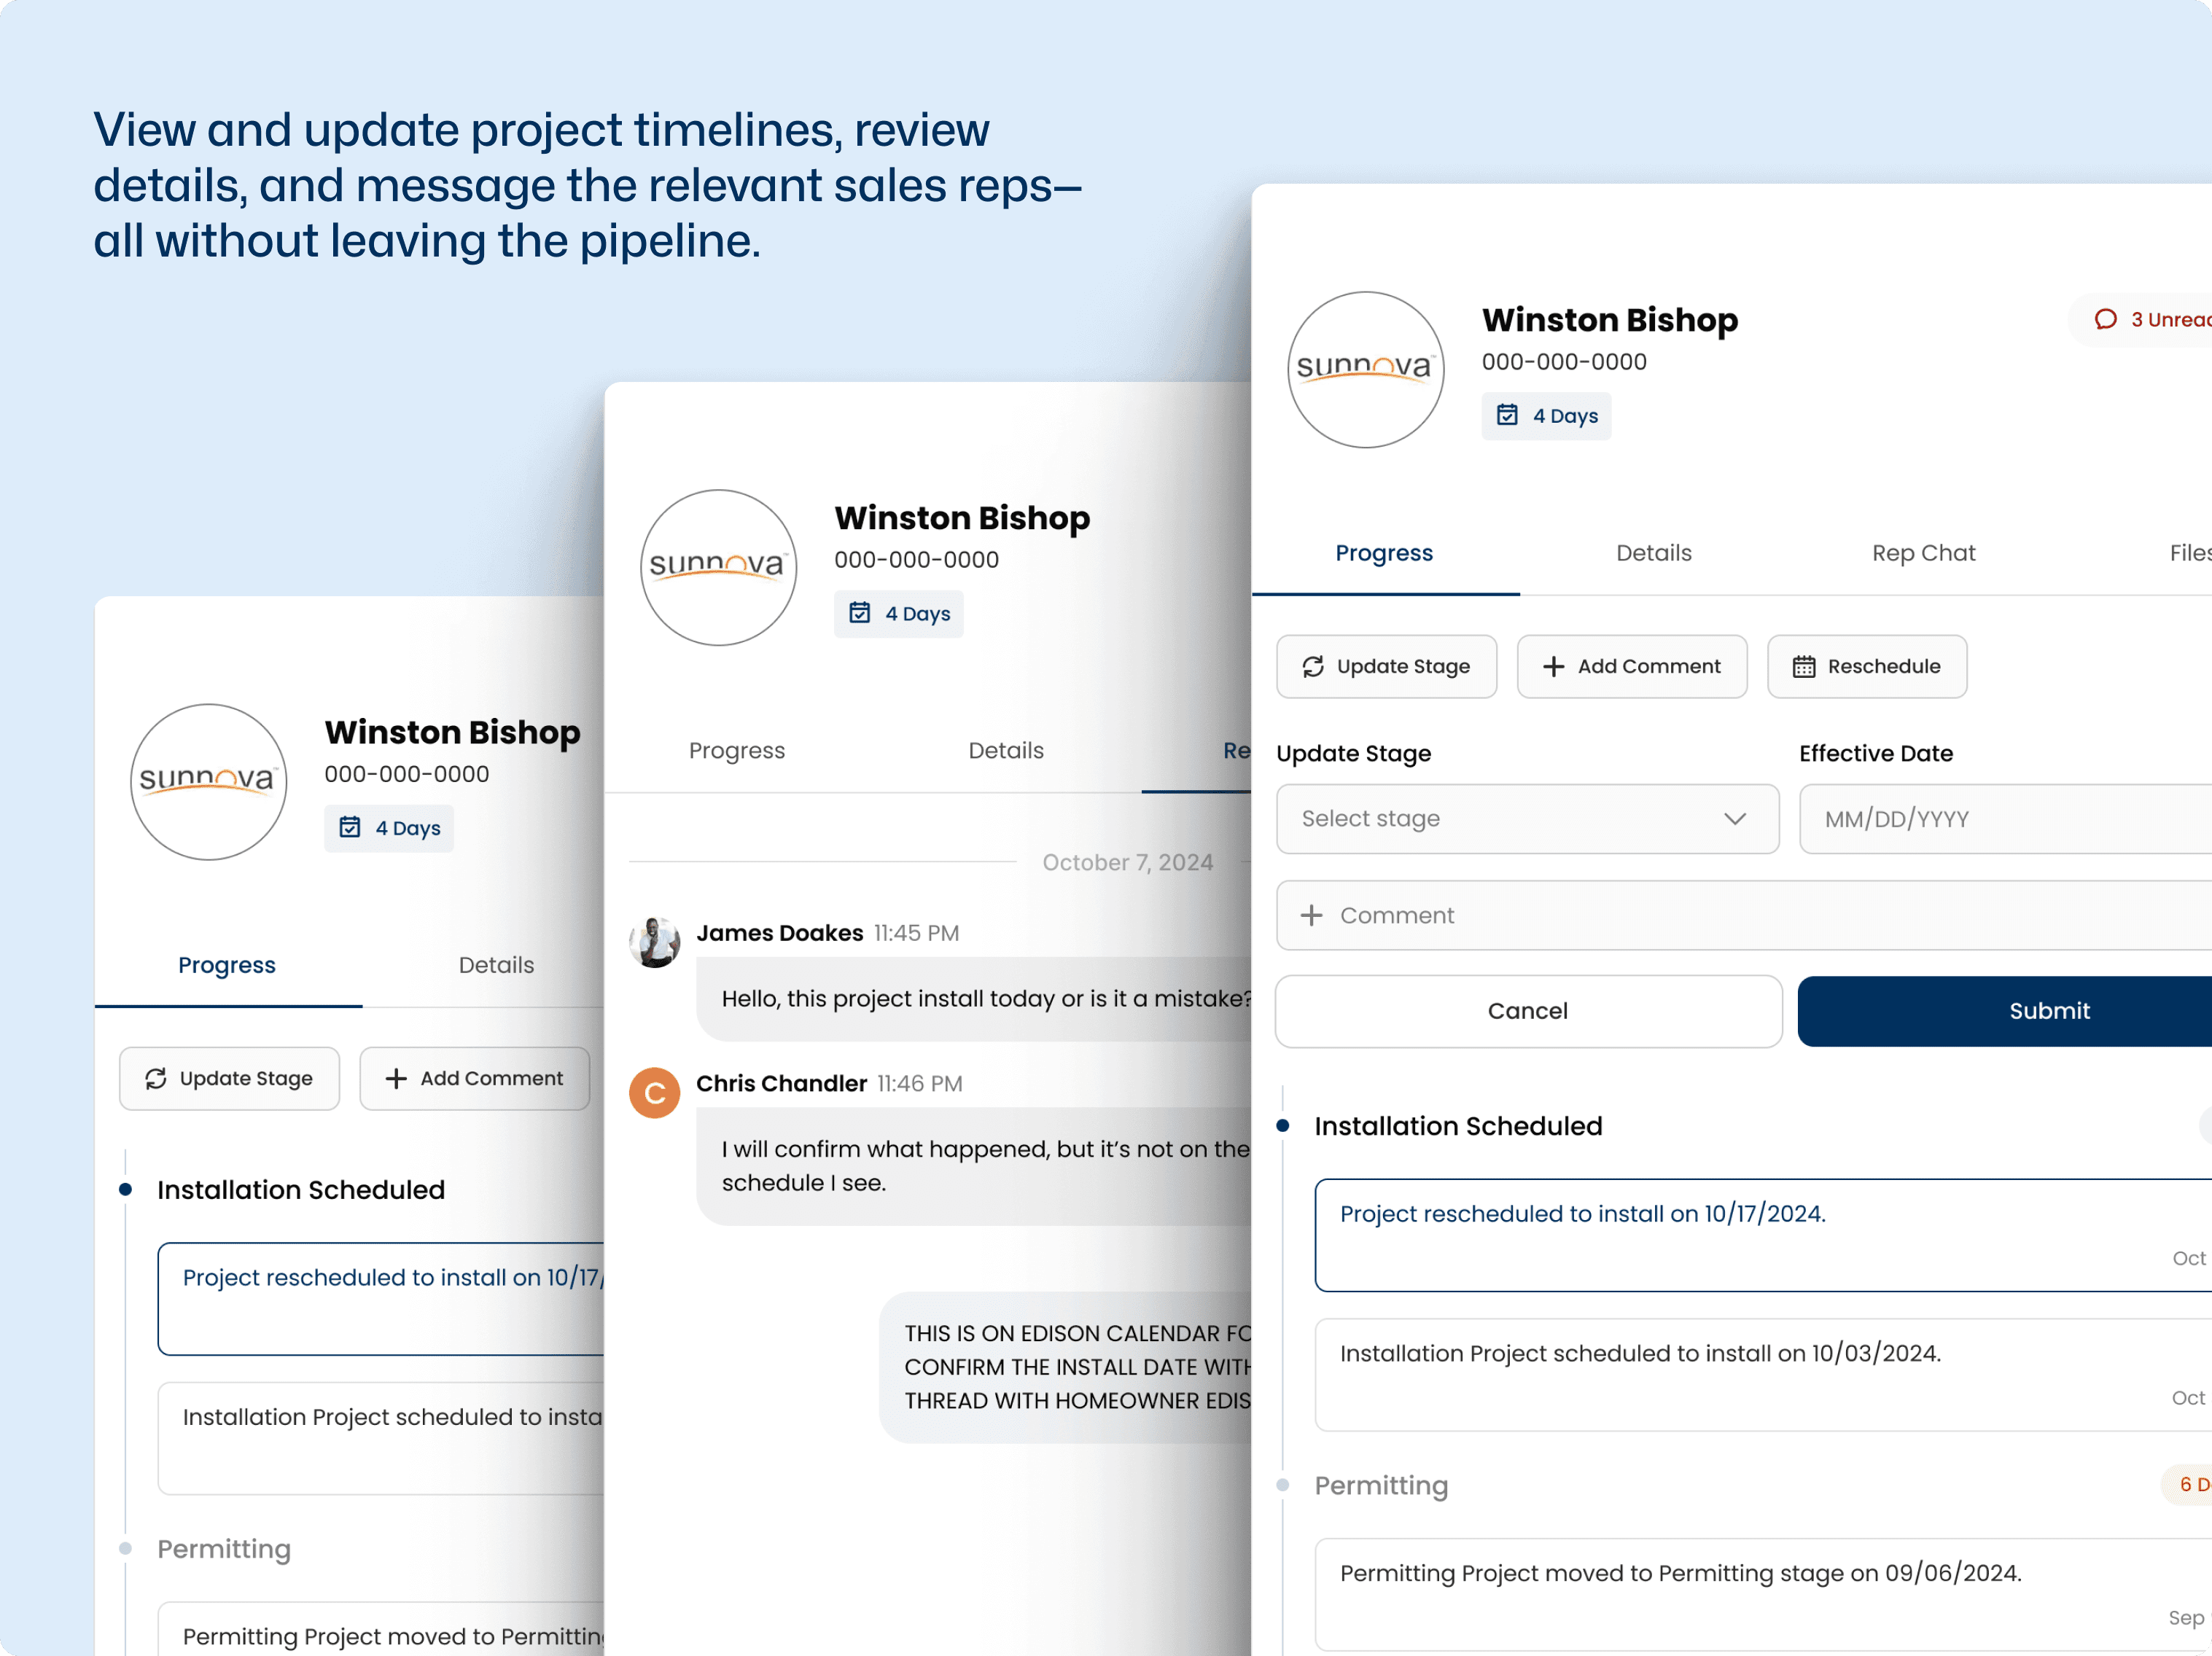
Direct Access to Project Timelines, Details, and Chats allowing PMs to take immediate action
Direct Access to Project Timelines, Details, and Chats allowing PMs to take immediate action
Direct Access to Project Timelines, Details, and Chats allowing PMs to take immediate action
Impact
⏳ Saved PMs hours per week by eliminating CSV exports.
🔍 Helped leadership identify and immediately resolve thousands of delayed projects more quickly.
🎯 Increased adoption by making the tool align with real PM workflows.
Here’s what the CTO had to say about me :)
⏳ Saved PMs hours per week by eliminating CSV exports.
🔍 Helped leadership identify and immediately resolve thousands of delayed projects more quickly.
🎯 Increased adoption by making the tool align with real PM workflows.
Here’s what the CTO had to say about me :)
⏳ Saved PMs hours per week by eliminating CSV exports.
🔍 Helped leadership identify and immediately resolve thousands of delayed projects more quickly.
🎯 Increased adoption by making the tool align with real PM workflows.
Here’s what the CTO had to say about me :)

Reflection
& Lessons Learned
Reflection & Lessons Learned
Reflection & Lessons Learned
This project pushed me to navigate conflicting stakeholder needs. Leadership wanted high-level insights, while PMs needed a tool that fit their daily workflow. Figuring out how to keep both happy without overcomplicating the design taught me a lot about flexibility and prioritization.
An unexpected challenge at the end was making sense of highly skewed project data. Some installers had 500 projects, while others had just 10, which made visualizing the data in a clear and scannable way tricky. Figuring out what stats were both technically feasible to calculate and actually useful to users also required deep collaboration with the engineers and PMs.